Top Bay Area Public Schools for Underserved Students
2016 Report

Keep up with the latest
For the second year in a row, the Bay Area is doing worse than the rest of state
in educating low-income Latino and African American students.
Here’s a look at the dozens of local schools proving it doesn’t have to be that way.
Pain and Promise in CAASPP’s Second Year
Scores are up overall, but they aren’t rising fast enough for underserved students.
In 2010, California started one of the biggest shifts in teaching and learning in decades. The state raised the bar for how much students would be expected to learn, in order to do a better job of preparing students for college and careers. Last year, students across the state took a new test that measured their mastery of those new, higher standards – the California Assessment of Student Performance and Progress (CAASPP).
In that first year, performance was low: only 44% of students met standards in English and only 34% met the standards in math.
In August, California published the second year of results. The good news is that scores improved overall, with 48% of students in the state meeting standards in English, and 37% testing at grade level1 in math.
Yet, disturbingly, as scores went up, achievement gaps for African American, Latino and low-income students stayed as wide as they had been in the first year, and in some cases even widened. While test scores don’t tell the full story of how schools are doing, they are an important sign of how well we’re preparing students. We still have a long way to go.
While the Bay Area outperforms the state average overall, low-income African American and Latino students actually fare worse in the Bay Area than other areas of the state. Low-income African American and low-income Latino students in the Bay Area are well below the state average in both English and math, and the vast majority are still not meeting standards. Despite that troubling picture, there are signs of hope – schools that are bucking the trend and proving that a child’s zip code need not decide her educational future.
At Innovate Public Schools, we believe that it is possible for all schools to achieve strong results for underserved students. This year’s Top Schools report highlights 472 Bay Area public schools that achieved strong results for underserved students in English and/or math. We want to celebrate these schools and encourage attention to their practices, so that all schools in the Bay Area can learn from what works.
1Innovate defines “testing at grade level” to be meeting or exceeding state standards on the CAASPP standardized exam.
2The original report published on September 27, 2016 listed 41 unique schools that met our threshold. An additional eight schools met our threshold after an updated data file was released, and two from the original list no longer qualified and were removed.
Across the State, Huge Numbers of Students Are Underserved
This report examines the 2015-16 test scores to see how Bay Area schools served low-income Latino and low-income African American students. Our analysis highlights schools in the Bay Area where the proficiency rates in English and math for these two student groups are at least as high as the state averages for all students.
Low-income African American and Latino students are historically underserved, and tend to score much lower than their peers on standardized tests. Together, these two groups make up almost half of all students in California.

Bay Area Schools Still Show Wide Achievement Gaps Between Groups
Although it is positive and important that scores increased for many groups of students in 2016, they didn’t increase as much for low-income students. In the Bay Area, only 35% of all low-income students are meeting or exceeding state standards in English, compared to 76% of other students – a difference of over 40 percentage points. In math, the gap is even larger – 43 percentage points.

Poverty Does Not Explain the Achievement Gap in Bay Area Schools
For the second year in a row, many Bay Area schools also continue to show dramatic gaps between different racial/ethnic groups within the same economic status. For example, low-income African American students are still a full 24 percentage points behind white students from low-income families, and 41 points behind low-income Asian students, in English. This gap between low-income African American and low-income Asian students is even larger in math, with a difference of 48 points. This means that most Bay Area schools are not closing the achievement gaps for all students.

For the Second Year, the Bay Area Trails the State in Test Scores for Underserved Students
Although the Bay Area as a whole scored higher than the state average for all students, low-income African American and low-income Latino students’ scores in the Bay Area are still far below the state average. More than seven out of 10 low-income Latino students, and more than eight out of 10 low-income African American students, scored below grade level.

 California ranks at the bottom in student achievement nationwide

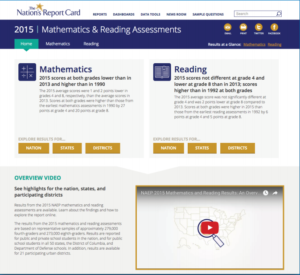
It is hard to compare student achievement across states because they use different tests to measure student learning. The one exception is the National Assessment of Educational Progress (NAEP) which is given in every state. In the most recent NAEP release, California ranked at or near the bottom of all of the states and the District of Columbia. For example, fourth graders in California ranked 48th and 49th out of the 50 states and D.C. in math and reading, respectively.3
3The National Assessment of Educational Progress (NAEP) results were most recently published in October 2015. The data were last accessed on September 12, 2016. More detailed results are available at http://www.nationsreportcard.gov/
Forty-seven Bay Area Schools Stand Out in Results for Underserved Students
Despite this troubling picture, the encouraging and exciting news is that a few dozen schools are achieving strikingly different results. These schools are beacons of hope, offering opportunities and lessons that all of us can learn from, build on and spread widely. At these schools, low-income African American and Latino students are outdoing the state averages – sometimes by a wide margin. In fact, some of the schools highlighted in this report are so high-performing that they’ve effectively closed the achievement gap for some groups of traditionally underserved students. Some schools have scores for their low-income Latino and African American students that are up to four times the state average for their subgroup in English and math.
Our report looks at traditional district and charter public schools across the five Bay Area counties (Alameda, Contra Costa, San Francisco, San Mateo and Santa Clara). Schools that are selective in choosing which students to admit, including alternative schools and others flagged by the CDE, were not eligible for inclusion in this report.
The Top Schools listed in this report meet the following criteria:
- The school has at least the state average percentage of low-income Latino students (43.3%) or low-income African American students (4.3%).
- The participation rate (the number of students tested divided by the number of students enrolled in a school) was at least 95% when rounded. This high participation rate assures that the school is testing practically all students and not somehow discouraging some students from getting tested, which could artificially inflate school-wide scores.
- The school’s proficiency rate for low-income African American students in math or English meets or exceeds the state average proficiency rate for all students, OR
- The school’s proficiency rate for low-income Latino students in math or English meets or exceeds the state average proficiency rate for all students.
From the total of 568 traditional district and public charter schools serving a large number of underserved students in the Bay Area, only 47 unique schools achieved better results on the 2015-16 state tests for their underserved students than the state’s overall average for all students in English and/or math5. This number is far too low, and it underlines how rare these schools are. Especially striking is the fact that only one high school in the entire Bay Area met our criteria for low-income African American students in English and math. Despite that, the schools featured in this report offer models from which we can hope to greatly increase the number of great opportunities for our underserved kids.
The schools that met – and in many cases exceeded – these criteria are featured on the next few sections of this report6

4Four schools on our lists qualified as both an elementary and a middle school, amounting to 51 “schools” on our lists when considering school type.
5The CDE data file used for these analyses was accessed on October 20, 2016 at http://caaspp.cde.ca.gov/sb2016/ResearchFileList.
6For a description of the report methodology used for this analysis, see the methodology page at the end of the report.
Top-Performing Bay Area Public Schools
for Low-income Latino Students in English
Among schools that have at least 43.3% low-income Latino students, which is the state average
Click on a section to view details
Elementary
| NAME OF SCHOOL | LOW INCOME LATINO % PROFICIENT IN ENGLISH | CHANGE FROM LAST YEAR | DISTRICT | CHARTER SCHOOL NETWORK | SUBGROUP % IN SCHOOL | IN LAST YEAR’S REPORT |
|---|---|---|---|---|---|---|
| Gilroy Prep (Charter) | 77% | +1 | Gilroy Unified | Navigator Public Schools | 48% | Yes |
| Mission Preparatory (Charter) | 72% | +38 | SBE - Mission Preparatory | Mission Preparatory | 73% | Yes (in math) |
| KIPP Excelencia Community Preparatory | 56% | N/A | Redwood City Elementary | KIPP Bay Area Schools | 82% | |
| KIPP Heritage Academy (Charter) | 54% | +2 | Franklin-McKinley Elementary | KIPP Bay Area Schools | 52% | Yes |
| Kipp Prize Preparatory Academy(Charter) | 49% | +14 | Alum Rock Union Elementary | KIPP Bay Area Schools | 73% | |
| Highland Elementary | 49% | +5 | West Contra Costa Unified | 51% | Yes | |
| Voices College-Bound Language Academy (Charter) | 48% | +13 | Franklin-McKinley Elementary | Voices College-Bound Language Academies | 66% | |
| Rod Kelley Elementary | 47% | +10 | Gilroy Unified | 59% | Yes (in math) | |
| Rocketship Discovery Prep (Charter) | 45% | +17 | Santa Clara County Office of Education | Rocketship Education | 76% | Yes (in math) |
Middle
| NAME OF SCHOOL | LOW INCOME LATINO % PROFICIENT IN ENGLISH | CHANGE FROM LAST YEAR | DISTRICT | CHARTER SCHOOL NETWORK | SUBGROUP % IN SCHOOL | IN LAST YEAR’S REPORT |
|---|---|---|---|---|---|---|
| KIPP Summit Academy (Charter) | 76% | +4 | San Lorenzo Unified | KIPP Bay Area Schools | 43% | Yes (in math) |
| Voices College-Bound Language Academy (Charter) | 73% | 0 | Franklin-McKinley Elementary | Voices College-Bound Language Academies | 66% | |
| Ida Jew Academies (Charter) | 65% | +23 | Mount Pleasant Elementary | 65% | Yes | |
| KIPP Heartwood Academy (Charter) | 58% | +4 | Alum Rock Union Elementary | KIPP Bay Area Schools | 75% | Yes |
| Edison Charter Academy | 50% | +20 | San Francisco Unified | 69% | ||
| KIPP San Francisco Bay Academy | 50% | +10 | San Francisco Unified | KIPP Bay Area Schools | 60% | |
| Crittenden Middle | 50% | +14 | Mountain View Whisman | 45% |
High School
| NAME OF SCHOOL | LOW INCOME LATINO % PROFICIENT IN ENGLISH | CHANGE FROM LAST YEAR | DISTRICT | CHARTER SCHOOL NETWORK | SUBGROUP % IN SCHOOL | IN LAST YEAR’S REPORT |
|---|---|---|---|---|---|---|
| Lighthouse Community Charter High (Charter) | 86% | +8 | Oakland Unified | Lighthouse Community Public Charter Schools | 74% | Yes |
| Impact Academy of Arts & Technology (Charter) | 84% | +8 | Hayward Unified | Envision Schools | 48% | Yes |
| Summit Preparatory Charter High (Charter) | 83% | +17 | Sequoia Union High | Summit Public Schools | 46% | Yes |
| Leadership Public Schools: Hayward (Charter) | 79% | +9 | Hayward Unified | Leadership Public Schools | 53% | Yes |
| KIPP San Francisco College Preparatory | 77% | N/A | San Francisco Unified | KIPP Bay Area Schools | 50% | |
| Leadership Public Schools: Richmond (Charter) | 78% | +21 | West Contra Costa Unified | Leadership Public Schools | 88% | Yes |
| Making Waves Academy (Charter) | 67% | +1 | Contra Costa County Office of Education | 75% | Yes | |
| Oakland Unity High (Charter) | 63% | -11 | Oakland Unified | Unity Schools | 74% | Yes |
Top-Performing Bay Area Public Schools
for Low-income Latino Students in Math
Among schools that have at least 43.3% low-income Latino students, which is the state average
Click on a section to view details
Elementary
| NAME OF SCHOOL | LOW INCOME LATINO % PROFICIENT IN MATH | CHANGE FROM LAST YEAR | DISTRICT | CHARTER SCHOOL NETWORK | SUBGROUP % IN SCHOOL | IN LAST YEAR’S REPORT |
|---|---|---|---|---|---|---|
| Mission Preparatory (Charter) | 65% | +15 | SBE - Mission Preparatory | Mission Preparatory | 73% | Yes |
| KIPP Excelencia Community Preparatory | 62% | N/A | Redwood City Elementary | KIPP Bay Area Schools | 82% | |
| Gilroy Prep (Charter) | 60% | +4 | Gilroy Unified | Navigator Public Schools | 48% | Yes |
| E. M. Grimmer Elementary | 57% | +13 | Fremont Unified | 45% | Yes | |
| Rocketship Alma Academy (Charter) | 54% | +12 | Santa Clara County Office of Education | Rocketship Education | 80% | Yes |
| Rocketship Spark Academy (Charter) | 54% | -4 | Franklin-McKinley Elementary | Rocketship Education | 56% | Yes |
| Rocketship Mosaic Elementary (Charter) | 53% | +1 | Franklin-McKinley Elementary | Rocketship Education | 57% | Yes |
| Rocketship Discovery Prep (Charter) | 51% | +11 | Santa Clara County Office of Education | Rocketship Education | 76% | Yes |
| Rocketship Si Se Puede Academy (Charter) | 48% | +8 | Santa Clara County Office of Education | Rocketship Education | 81% | Yes |
| Serra (Junipero) Elementary | 46% | +31 | San Francisco Unified | 68% | ||
| Rod Kelley Elementary | 46% | 0 | Gilroy Unified | 59% | Yes | |
| Richmond College Preparatory (Charter) | 44% | +2 | West Contra Costa Unified | Richmond College Preparatory | 57% | Yes |
| Los Medanos Elementary | 43% | -5 | Pittsburg Unified | 57% | Yes | |
| Rocketship Mateo Sheedy Elementary (Charter) | 42% | +1 | Santa Clara County Office of Education | Rocketship Education | 81% | Yes |
| Aspire East Palo Alto Charter (Charter) | 40% | +13 | Ravenswood City Elementary | Aspire Public Schools | 82% | |
| Edison Charter Academy | 39% | +31 | San Francisco Unified | 69% | ||
| Ida Jew Academies (Charter) | 39% | +10 | Mount Pleasant Elementary | 65% | ||
| Highland Elementary | 39% | +6 | West Contra Costa Unified | 51% | Yes (in English) |
Middle
| NAME OF SCHOOL | LOW INCOME LATINO % PROFICIENT IN MATH | CHANGE FROM LAST YEAR | DISTRICT | CHARTER SCHOOL NETWORK | SUBGROUP % IN SCHOOL | IN LAST YEAR’S REPORT |
|---|---|---|---|---|---|---|
| KIPP Summit Academy (Charter) | 61% | -1 | San Lorenzo Unified | KIPP Bay Area Schools | 43% | Yes |
| KIPP Heartwood Academy (Charter) | 58% | +17 | Alum Rock Union Elementary | KIPP Bay Area Schools | 75% | Yes |
| Voices College-Bound Language Academy (Charter) | 50% | +1 | Franklin-McKinley Elementary | Voices College-Bound Language Academies | 66% | |
| Richmond Charter Academy (Charter) | 39% | -1 | West Contra Costa Unified | Amethod Public Schools Inc. | 84% | Yes |
| Ida Jew Academies (Charter) | 39% | +8 | Mount Pleasant Elementary | 65% | Yes (in English) |
High School
| NAME OF SCHOOL | LOW INCOME LATINO % PROFICIENT IN MATH | CHANGE FROM LAST YEAR | DISTRICT | CHARTER SCHOOL NETWORK | SUBGROUP % IN SCHOOL | IN LAST YEAR’S REPORT |
|---|---|---|---|---|---|---|
| Lighthouse Community Charter High (Charter) | 53% | -1 | Oakland Unified | Lighthouse Community Public Charter Schools | 74% | Yes |
| KIPP San Francisco College Preparatory | 51% | N/A | San Francisco Unified | KIPP Bay Area Schools | 50% | |
| Making Waves Academy (Charter) | 46% | +8 | Contra Costa County Office of Education | Making Waves Academy | 75% | Yes |
| Impact Academy of Arts & Technology (Charter) | 39% | -4 | Hayward Unified | Envision Schools | 48% | Yes |
| Oakland Unity High (Charter) | 38% | -8 | Oakland Unified | Unity Schools | 74% | Yes |
| Pescadero High | 38% | N/A | La Honda-Pescadero Unified | 63% | ||
| Leadership Public Schools - Hayward (Charter) | 37% | -11 | Hayward Unified | Leadership Public Schools | 53% | Yes |
| Aspire Lionel Wilson College Preparatory Academy (Charter) | 36% | +11 | Oakland Unified | Aspire Public Schools | 86% | Yes |
Top-Performing Bay Area Public Schools
for Low-income African American Students in English
Among schools that have at least 4.3% low-income African American students, which is the state average
Click on a section to view details
Elementary
| NAME OF SCHOOL | LOW INCOME AFRICAN AMERICAN % PROFICIENT IN ENGLISH | CHANGE FROM LAST YEAR | DISTRICT | CHARTER SCHOOL NETWORK | SUBGROUP % IN SCHOOL | IN LAST YEAR’S REPORT |
|---|---|---|---|---|---|---|
| Sherman Elementary | 58% | N/A | San Francisco | 7% | ||
| Peralta Elementary | 55% | +14 | Oakland Unified | 11% | Yes | |
| Canoas Elementary | 55% | N/A | San Jose Unified | 5% | ||
| Rocketship Mateo Sheedy Elementary | 52% | +14 | Santa Clara County Office of Education | Rocketship Education | 6% | Yes (in math) |
| Montalvin Manor Elementary | 50% | +11 | West Contra Costa Unified | 11% | ||
| Southgate Elementary | 50% | +14 | Hayward Unified | 7% | ||
| Cleveland Elementary | 48% | +5 | Oakland Unified | 12% | Yes | |
| Kathryn Hughes Elementary | 47% | +31 | Santa Clara Unified | 7% | ||
| Lincoln Elementary | 46% | -6 | Oakland Unified | 6% | Yes | |
| Hanna Ranch Elementary | 45% | +15 | West Contra Costa Unified | 8% |
Middle
| NAME OF SCHOOL | LOW INCOME AFRICAN AMERICAN % PROFICIENT IN ENGLISH | CHANGE FROM LAST YEAR | DISTRICT | CHARTER SCHOOL NETWORK | SUBGROUP % IN SCHOOL | IN LAST YEAR’S REPORT |
|---|---|---|---|---|---|---|
| KIPP Bayview Academy | 58% | +20 | San Francisco Unified | KIPP Bay Area Schools | 40% | |
| American Indian Public Charter (Charter) | 56% | +25 | Oakland Unified | The American Indian Model (AIM) | 15% | |
| Orchard Park | 54% | -1 | Antioch Unified | 9% | Yes |
High School
| NAME OF SCHOOL | LOW INCOME AFRICAN AMERICAN % PROFICIENT IN ENGLISH | CHANGE FROM LAST YEAR | DISTRICT | CHARTER SCHOOL NETWORK | SUBGROUP % IN SCHOOL | IN LAST YEAR’S REPORT |
|---|---|---|---|---|---|---|
| KIPP San Francisco College Preparatory | 87% | N/A | San Francisco Unified | KIPP Bay Area Schools | 26% |
Top-Performing Bay Area Public Schools
for Low-income African American Students in Math
Among schools that have at least 4.3% low-income African American students, which is the state average
Click on a section to view details
Elementary
| NAME OF SCHOOL | LOW INCOME AFRICAN AMERICAN % PROFICIENT IN MATH | CHANGE FROM LAST YEAR | DISTRICT | CHARTER SCHOOL NETWORK | SUBGROUP % IN SCHOOL | IN LAST YEAR’S REPORT |
|---|---|---|---|---|---|---|
| Sherman Elementary | 58% | N/A | San Francisco Unified | 7% | ||
| American Indian Public Charter School II (Charter) | 50% | N/A | Oakland Unified | The American Indian Model (AIM) | 17% | |
| Cleveland Elementary | 44% | -6 | Oakland Unified | 12% | Yes |
Middle
| NAME OF SCHOOL | LOW INCOME AFRICAN AMERICAN % PROFICIENT IN MATH | CHANGE FROM LAST YEAR | DISTRICT | CHARTER SCHOOL NETWORK | SUBGROUP % IN SCHOOL | IN LAST YEAR’S REPORT |
|---|---|---|---|---|---|---|
| American Indian Public Charter School II (Charter) | 50% | -17 | Oakland Unified | The American Indian Model (AIM) | 17% | Yes |
| American Indian Public Charter (Charter) | 44% | +21 | Oakland Unified | The American Indian Model (AIM) | 15% |
High School
| NAME OF SCHOOL | LOW INCOME AFRICAN AMERICAN % PROFICIENT IN MATH | CHANGE FROM LAST YEAR | DISTRICT | CHARTER SCHOOL NETWORK | SUBGROUP % IN SCHOOL | IN LAST YEAR’S REPORT |
|---|---|---|---|---|---|---|
| KIPP San Franciso College Preparatory | 47% | N/A | San Francisco Unified | KIPP Bay Area Schools | 26% |
What do top schools do right?
There is a wide range of schools on our Top Schools list, including traditional district schools and charter schools of varying sizes and school types. There is not one exclusive model that defines a top school, but it is true that many high-performing schools have similar practices. The best schools in the country are often driven by a very clear mission, use data to inform decisions, build a great staff, offer rigorous academics for all students, cultivate a culture of joyful learning, and engage parents as co-educators and leaders.
Learn more in our report, “How World-class Schools Deliver for All Students.”
Increasing Proficiency Rates
With two years of CAASPP scores, it is now possible to look at each school’s change in the percentage of students meeting standards since last year. Across the state, proficiency rates for all students went up 4% in English and 3% in math, with some schools showing much bigger increases. Although many different factors can affect a school’s performance, these numbers are a signal that a school may be improving over time. The four schools below had the largest positive changes in proficiency for low-income African American and Latino students since last year.
Click on a section to view details
Schools with the Largest Change in Proficiency Since Last Year
Low-income Latino in English
| NAME OF SCHOOL | LOW INCOME LATINO % PROFICIENT IN ENGLISH | CHANGE FROM LAST YEAR | DISTRICT | CHARTER SCHOOL NETWORK | SUBGROUP % IN SCHOOL | IN THIS YEAR’S REPORT |
|---|---|---|---|---|---|---|
| Mission Preparatory (charter) | 73% | +39 | State Board of Education | Mission Preparatory | 73% | YES |
Low-income Latino in Math
| NAME OF SCHOOL | LOW INCOME LATINO % PROFICIENT IN MATH | CHANGE FROM LAST YEAR | DISTRICT | CHARTER SCHOOL NETWORK | SUBGROUP % IN SCHOOL | IN THIS YEAR’S REPORT |
|---|---|---|---|---|---|---|
| Serra (Junipero) Elementary | 46% | +31 | San Francisco Unified | 68% | YES |
Schools with the Largest Change in Proficiency Since Last Year
Low-income African American in English
| NAME OF SCHOOL | LOW INCOME AFRICAN AMERICAN % PROFICIENT IN ENGLISH | CHANGE FROM LAST YEAR | DISTRICT | CHARTER SCHOOL NETWORK | SUBGROUP % IN SCHOOL | IN THIS YEAR’S REPORT |
|---|---|---|---|---|---|---|
| Kathryn Hughes Elementary | 47% | +31 | Santa Clara Unified | Santa Clara Unified | 7% | YES |
Low-income African American in Math
| NAME OF SCHOOL | LOW INCOME AFRICAN AMERICAN % PROFICIENT IN MATH | CHANGE FROM LAST YEAR | DISTRICT | CHARTER SCHOOL NETWORK | SUBGROUP % IN SCHOOL | IN THIS YEAR’S REPORT |
|---|---|---|---|---|---|---|
| Serra (Junipero) Elementary | 33% | +25 | San Francisco Unified | 7% | YES |
There is Hope, But We Have Work To Do
From all the data and analysis on California’s new standards and tests, two clear facts emerge. One is that, as it stands today, the deck is stacked against low-income African American and Latino students, particularly in the Bay Area. The second is that it doesn’t need to be that way. Despite the real and enormous challenges in communities of poverty, a small but significant number of schools are setting their students on track for successful, secure lives. In a region known for its extraordinary wealth of money and talent, we must find the energy and will to do that for more of our children. At Innovate Public Schools, we are committed to supporting families and communities as they fight for the change that all of our children deserve.

What top schools look like in action

Impact Academy of Arts and Technology: Building a College-Going Culture
A young man in a suit rises and stands before a panel of judges…

Rod Kelley Elementary: Ensuring Rigorous Academics for All Students
First grade teacher Nathan Lober remembers the 2000s at Rod Kelley Elementary…
Learn More and Get Involved
Don’t see your school featured in our report? Visit our website to find out how schools in your community are doing for underserved students. You can also find profiles of top schools and how you can take action to make sure all students get a high-quality education.
About Innovate Public Schools
Innovate Public Schools is a nonprofit organization working to make sure that all students in the Bay Area — especially low-income students and students of color — receive a world-class public education that prepares them for success in college, careers and beyond. We’re building a movement of families, educators, and business and elected leaders who together will make this vision a reality. We build the capacity of parents and educators to innovate and act together to create world-class public schools, and we publish easy-to-understand school quality data and research that highlights both problems and solutions.
Receive the latest from Innovate Public Schools.