


2019
TOP LOS ANGELES COUNTY
Public schools for
Underserved students
EXPLORE THE REPORT
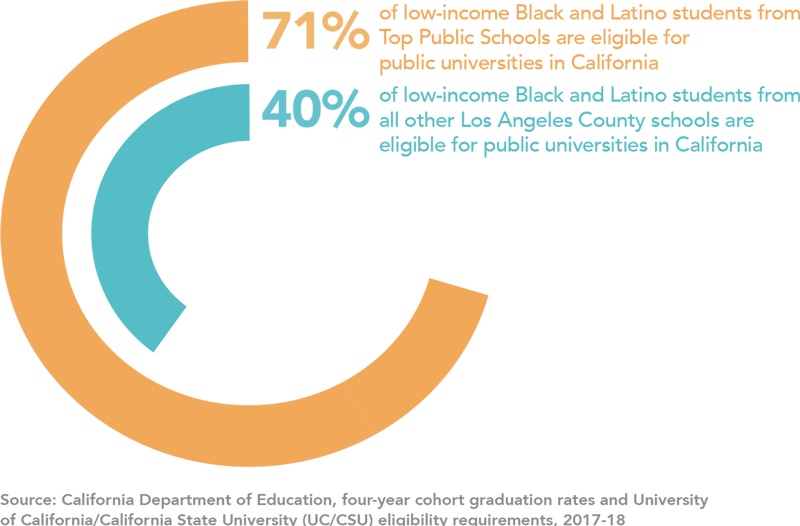
There is no achievement gap at birth.1 It’s time to stop questioning what low-income students of color can achieve in school and time to start focusing on learning from the public schools that are beating the odds.
When offered equal access to rigorous coursework, strong instruction, and teachers with high expectations, all students — regardless of race and ethnicity — achieve at high levels, oftentimes closing existing gaps.2 Unfortunately, many kids are being failed by school systems that are not equipping them to achieve their full potential. Many factors hold kids back: poverty, systemic racism, language barriers, and struggles at home or in their community. These are compounded by limited funding to schools, and district and statewide policies and practices that don’t work.
But some schools are finding ways to help all of their students succeed, despite the many socioeconomic barriers and barriers in our public school system. These schools are currently the exception, not the rule. But they each show us what a single school can do. They show us what’s possible despite the odds.
Our Top Public Schools for Underserved Students report highlights those schools closing the achievement gap for low-income African American and Latino students in Los Angeles County. Since 2015, we have produced this report annually for Bay Area schools. This is our first year producing the report for Los Angeles County.
To qualify, schools must beat the statewide average in one or more factors including math and reading scores, and college eligibility rates, and suspension data. Still, when you talk to leaders of schools on this list, they will tell you that it is not enough. “While we are pleased to see some schools closing the achievement gap, we all still have a long way to go to achieve true and equitable excellence for our students who have historically been left behind,” says Superintendent Jeff Pelzel of Newhall School District.
There is much work yet to be done for Los Angeles’ students, but our list highlights the schools that are leading the way. We hope educators, civic leaders, parents, and students across Los Angeles can get inspired by their example. We believe all schools in Los Angeles County can become Top Public Schools.
1. Delpit, Lisa D. (2012). “Multiplication is for White people: raising expectations for other people’s children.” New York: New Press. Distributed by Perseus Distribution.
2. TNTP (2018). The Opportunity Myth: What students can show us about how school is letting them down– and how to fix it.
Low-income Latino
Low-income African American
There are
Los Angeles schools
2,068
Los Angeles schools
473
schoolsserve at least 20
low-income African
American students**
Only
are Top Schools
31
of themare Top Schools
Source: California Department of Education, 2017-18 Enrollment files
**Schools were considered in this analysis if they had at least 20 low-income African American students and this sub-group comprises 4% or more of the school's overall enrollment.
**Schools were considered in this analysis if they had at least 20 low-income African American students and this sub-group comprises 4% or more of the school's overall enrollment.

LOS ANGELES COUNTY TOP PUBLIC SCHOOLS LISTS
Click on links below to view related school lists.
ELEMENTARY SCHOOLS
These schools are closing achievement gaps and setting students on a path to college
Top Public Schools for Low-income African American Students in English
| wdt_ID | School | % Low-income African American proficient in English | District | Region | Low-income African American % in school | Charter school network | |
|---|---|---|---|---|---|---|---|
| 1 | 1 | Wilder's Preparatory Academy Charter (Charter) | 81% | Inglewood Unified | South Bay | 58% | Wilder's Preparatory Academies |
| 2 | 2 | Elliott (William F) Elementary | 76% | ABC Unified | Southeast | 6% | |
| 3 | 3 | Signal Hill Elementary | 62% | Long Beach Unified | Harbor | 15% | |
| 4 | 4 | Chapman Elementary | 62% | Los Angeles Unified | South Bay | 12% | |
| 5 | 5 | Will Rogers Elementary | 60% | Santa Monica-Malibu Unified | Westside | 6% | |
| 6 | 6 | El Rincon Elementary | 60% | Culver City Unified | Westside | 12% | |
| 7 | 7 | Intensive Learning Center | 58% | Bellflower Unified | Harbor | 13% | |
| 8 | 8 | Valley View Community Elementary | 56% | Sulphur Springs Union | Northwest County | 6% | |
| 9 | 9 | Holmes Elementary | 55% | Long Beach Unified | Harbor | 30% | |
| 10 | 10 | Lucille J. Smith Elementary | 55% | Lawndale Elementary | South Bay | 9% | |
| 11 | 11 | Jefferson | 54% | Hawthorne | South Bay | 12% | |
| 12 | 12 | One Hundred Fifty-Sixth Street Elementary | 54% | Los Angeles Unified | South Bay | 17% | |
| 13 | 13 | Laurel Street Elementary | 54% | Compton Unified | Southeast | 15% | |
| 14 | 14 | Palms Elementary | 50% | ABC Unified | Harbor | 8% | |
| 15 | 15 | Broadacres Avenue Elementary | 50% | Los Angeles Unified | Harbor | 65% |
Top Public Schools for Low-income African American Students in Math
| wdt_ID | School | % Low-income African American proficient in Math | District | Region | Low-income African American % in school | Charter school network | |
|---|---|---|---|---|---|---|---|
| 1 | 1 | Wilder's Preparatory Academy Charter (Charter) | 69% | Inglewood Unified | South Bay | 58% | Wilder's Preparatory Academies |
| 2 | 2 | McKinley Elementary | 57% | Compton Unified | Southeast | 27% | |
| 3 | 3 | Signal Hill Elementary | 53% | Long Beach Unified | Harbor | 15% | |
| 4 | 4 | Elliott (William F) Elementary | 52% | ABC Unified | Southeast | 6% | |
| 5 | 5 | Jefferson | 51% | Hawthorne | South Bay | 12% | |
| 6 | 6 | Lucille J. Smith Elementary | 50% | Lawndale Elementary | South Bay | 9% | |
| 7 | 7 | El Rincon Elementary | 49% | Culver City Unified | Westside | 12% | |
| 8 | 8 | Chavez Elementary | 48% | Long Beach Unified | Harbor | 17% | |
| 9 | 9 | Laurel Street Elementary | 44% | Compton Unified | Southeast | 15% | |
| 10 | 10 | Broadacres Avenue Elementary | 44% | Los Angeles Unified | Harbor | 65% | |
| 11 | 11 | Bragg Elementary | 43% | ABC Unified | Southeast | 5% | |
| 12 | 12 | One Hundred Eighty-Sixth Street Elementary | 43% | Los Angeles Unified | Harbor | 14% | |
| 13 | 13 | Lomita Math/Science/Technology Magnet | 43% | Los Angeles Unified | South Bay | 9% | |
| 14 | 14 | Holmes Elementary | 42% | Long Beach Unified | Harbor | 30% |
Top Public Schools for Low-income Latino Students in English
| wdt_ID | School | % Low-income Latino proficient in English | District | Region | Low-income Latino % in school | Charter school network | |
|---|---|---|---|---|---|---|---|
| 1 | 1 | KIPP Raices Academy (Charter) | 77% | Los Angeles Unified | Eastside | 87% | KIPP LA Schools |
| 2 | 2 | Libertas College Preparatory Charter (Charter) | 72% | Los Angeles Unified | South L.A. | 70% | Building Excellent Schools |
| 3 | 3 | KIPP Comienza Community Prep (Charter) | 70% | Los Angeles Unified | Southeast | 92% | KIPP LA Schools |
| 4 | 4 | J. Marion Roynon Elementary | 68% | Bonita Unified | Pomona Valley | 45% | |
| 5 | 5 | Brainard Elementary | 68% | Los Angeles Unified | San Fernando Valley | 55% | |
| 6 | 6 | Vena Avenue Elementary | 67% | Los Angeles Unified | San Fernando Valley | 72% | |
| 7 | 7 | San Jose Charter Academy (Charter) | 67% | West Covina Unified | San Gabriel Valley | 44% | |
| 8 | 8 | Toluca Lake Elementary | 67% | Los Angeles Unified | San Fernando Valley | 61% | |
| 9 | 9 | KIPP Iluminar Academy (Charter) | 66% | Los Angeles Unified | Eastside | 88% | KIPP LA Schools |
| 10 | 10 | Gabriella Charter (Charter) | 65% | Los Angeles Unified | Central L.A. | 79% | Gabriella Charter Schools |
| 11 | 11 | Synergy Charter Academy (Charter) | 64% | Los Angeles Unified | South L.A. | 94% | Synergy Academies |
| 12 | 12 | Delevan Drive Elementary | 64% | Los Angeles Unified | Northeast L.A. | 44% | |
| 13 | 13 | Daniel Phelan Elementary | 63% | Whittier City Elementary | Southeast | 73% | |
| 14 | 14 | Unsworth (Edith) Elementary | 63% | Downey Unified | Southeast | 68% | |
| 15 | 15 | Valley View Community Elementary | 63% | Sulphur Springs Union | Northwest County | 57% | |
| 16 | 16 | Chapman Elementary | 63% | Los Angeles Unified | South Bay | 56% | |
| 17 | 17 | New Temple | 62% | Valle Lindo Elementary | San Gabriel Valley | 81% | |
| 18 | 18 | Potrero Heights Elementary | 62% | Montebello Unified | Southeast | 47% | |
| 19 | 19 | Kenmore Elementary | 62% | Baldwin Park Unified | San Gabriel Valley | 84% | |
| 20 | 20 | Queen Anne Place Elementary | 61% | Los Angeles Unified | Central L.A. | 80% | |
| 21 | 21 | Rowland Avenue Elementary | 61% | Covina-Valley Unified | San Gabriel Valley | 60% | |
| 22 | 22 | Equitas Academy Charter (Charter) | 61% | Los Angeles Unified | Central L.A. | 93% | Equitas Academy Charter School, Inc. |
| 23 | 23 | Ward (E. W.) Elementary | 60% | Downey Unified | Southeast | 78% | |
| 24 | 24 | Harding Street Elementary | 60% | Los Angeles Unified | San Fernando Valley | 69% | |
| 25 | 25 | Julia B. Morrison Elementary | 60% | Norwalk-La Mirada Unified | Southeast | 73% | |
| 26 | 26 | Clifford Street Elementary | 60% | Los Angeles Unified | Central L.A. | 61% | |
| 27 | 27 | Allesandro Elementary | 59% | Los Angeles Unified | Central L.A. | 71% | |
| 28 | 28 | Abraham Lincoln | 59% | Paramount Unified | Southeast | 88% | |
| 29 | 29 | Hoover Street Elementary | 59% | Los Angeles Unified | Central L.A. | 90% | |
| 30 | 30 | Robert Hill Lane Elementary | 58% | Los Angeles Unified | San Gabriel Valley | 84% | |
| 31 | 31 | Merlinda Elementary | 58% | West Covina Unified | San Gabriel Valley | 60% | |
| 32 | 32 | Park Western Place Elementary | 58% | Los Angeles Unified | Harbor | 44% | |
| 33 | 33 | Vista del Valle Elementary | 58% | Claremont Unified | Pomona Valley | 54% | |
| 34 | 34 | Williams (Spencer V.) Elementary | 58% | Downey Unified | Southeast | 64% | |
| 35 | 35 | Stagg Street Elementary | 58% | Los Angeles Unified | San Fernando Valley | 65% | |
| 36 | 36 | Longfellow (Henry W.) Elementary | 58% | Pasadena Unified | Verdugos | 58% | |
| 37 | 37 | William W. Orr Elementary | 58% | Little Lake City Elementary | Southeast | 70% | |
| 38 | 38 | Stevenson Elementary | 57% | Long Beach Unified | Harbor | 62% | |
| 39 | 39 | Mint Canyon Community Elementary | 57% | Sulphur Springs Union | Northwest County | 69% | |
| 40 | 40 | PUC Milagro Charter (Charter) | 57% | Los Angeles Unified | Eastside | 91% | PUC Schools |
| 41 | 41 | Price (Maude) Elementary | 57% | Downey Unified | Southeast | 62% | |
| 42 | 42 | Equitas Academy 4 (Charter) | 57% | Los Angeles Unified | Central L.A. | 92% | Equitas Academy Charter School, Inc. |
| 43 | 43 | Merced Elementary | 57% | West Covina Unified | San Gabriel Valley | 54% | |
| 44 | 44 | Eshelman Avenue Elementary | 57% | Los Angeles Unified | South Bay | 56% | |
| 45 | 45 | Bryson Avenue Elementary | 57% | Los Angeles Unified | Southeast | 82% | |
| 46 | 46 | Global Education Academy (Charter) | 56% | Los Angeles Unified | South L.A. | 96% | Global Education Collaborative |
| 47 | 47 | Mark Twain Elementary | 56% | Lawndale Elementary | South Bay | 49% | |
| 48 | 48 | Latona Avenue Elementary | 56% | Los Angeles Unified | Northeast L.A. | 86% | |
| 49 | 49 | Jefferson | 56% | Hawthorne | South Bay | 71% | |
| 50 | 50 | One Hundred Twenty-Second Street Elementary | 56% | Los Angeles Unified | South L.A. | 77% | |
| 51 | 51 | Paddison Elementary | 56% | Little Lake City Elementary | Southeast | 68% | |
| 52 | 52 | Nora Sterry Elementary | 56% | Los Angeles Unified | Northeast L.A. | 56% | |
| 53 | 53 | Celerity Rolas Charter (Charter) | 56% | SBE - Celerity Rolas | Northeast L.A. | 64% | Celerity Educational Group |
| 54 | 54 | Barranca Elementary | 55% | Covina-Valley Unified | San Gabriel Valley | 56% | |
| 55 | 55 | Cleminson Elementary | 55% | El Monte City | San Gabriel Valley | 50% | |
| 56 | 56 | Mayall Street Elementary | 55% | Los Angeles Unified | San Fernando Valley | 48% | |
| 57 | 57 | Lake Marie Elementary | 55% | South Whittier Elementary | Southeast | 83% | |
| 58 | 58 | Signal Hill Elementary | 55% | Long Beach Unified | Harbor | 49% | |
| 59 | 59 | Yorkdale Elementary | 55% | Los Angeles Unified | Northeast L.A. | 81% | |
| 60 | 60 | Paramount Elementary | 55% | Azusa Unified | San Gabriel Valley | 89% | |
| 61 | 61 | Mid-City's Prescott School of Enriched Sciences | 54% | Los Angeles Unified | South L.A. | 57% | |
| 62 | 62 | Wallen L. Andrews Elementary | 54% | Whittier City Elementary | San Gabriel Valley | 53% | |
| 64 | 63 | Today's Fresh Start Charter School Inglewood (Charter) | 54% | Inglewood Unified | South Bay | 46% | Today's Fresh Start Public Charter Schools |
| 65 | 64 | Gallatin Elementary | 54% | Downey Unified | Southeast | 49% | |
| 66 | 65 | Manzanita Elementary | 53% | Covina-Valley Unified | San Gabriel Valley | 65% | |
| 67 | 66 | Mulberry Elementary | 53% | East Whittier City Elementary | Southeast | 68% | |
| 68 | 67 | ISANA Palmati Academy (Charter) | 53% | Los Angeles Unified | San Fernando Valley | 84% | Celerity Educational Group |
| 69 | 68 | Laurel Street Elementary | 53% | Compton Unified | Southeast | 65% | |
| 70 | 69 | Telesis Academy of Science & Math | 53% | Rowland Unified | San Gabriel Valley | 71% | |
| 71 | 70 | Park Elementary | 53% | Alhambra Unified | San Gabriel Valley | 44% | |
| 72 | 71 | Leona H. Cox Community Elementary | 53% | Sulphur Springs Union | Northwest County | 52% | |
| 73 | 72 | Alvarado Elementary | 53% | Long Beach Unified | Harbor | 43% | |
| 74 | 73 | Lewis (Ed C.) Elementary | 53% | Downey Unified | Southeast | 63% | |
| 75 | 74 | Andasol Avenue Elementary | 53% | Los Angeles Unified | San Fernando Valley | 43% | |
| 76 | 75 | Diamond Point Elementary | 52% | Pomona Unified | San Gabriel Valley | 50% | |
| 77 | 76 | Vine Elementary | 52% | West Covina Unified | San Gabriel Valley | 43% | |
| 78 | 77 | Christian Sorensen Elementary | 52% | Whittier City Elementary | Southeast | 78% | |
| 79 | 78 | Maywood Elementary | 52% | Los Angeles Unified | Southeast | 88% | |
| 80 | 79 | Aspire Titan Academy (Charter) | 52% | Los Angeles Unified | Southeast | 96% | Aspire Public Schools |
| 81 | 80 | Studebaker Elementary | 52% | Little Lake City Elementary | Southeast | 62% | |
| 82 | 81 | Jefferson Elementary | 52% | Compton Unified | South L.A. | 88% | |
| 83 | 82 | Anderson Elementary | 52% | Compton Unified | South L.A. | 82% | |
| 84 | 83 | Aspire Gateway Academy Charter (Charter) | 52% | Los Angeles Unified | Southeast | 93% | Aspire Public Schools |
| 85 | 84 | Mill Elementary | 52% | Whittier City Elementary | San Gabriel Valley | 63% | |
| 86 | 85 | Cresson Elementary | 52% | Little Lake City Elementary | Southeast | 75% | |
| 87 | 86 | La Colima Elementary | 52% | East Whittier City Elementary | Southeast | 69% | |
| 88 | 87 | Dorris Place Elementary | 52% | Los Angeles Unified | Central L.A. | 67% | |
| 89 | 88 | California Elementary | 51% | Hacienda la Puente Unified | San Gabriel Valley | 84% | |
| 90 | 89 | Don Julian Elementary | 51% | Bassett Unified | San Gabriel Valley | 91% | |
| 91 | 90 | Albert Baxter Elementary | 51% | Bellflower Unified | Southeast | 70% | |
| 92 | 91 | Two Hundred Thirty-Second Place | 51% | Los Angeles Unified | Harbor | 44% | |
| 93 | 92 | ISANA Octavia Academy (Charter) | 51% | Los Angeles Unified | Northeast L.A. | 76% | Celerity Educational Group |
| 94 | 93 | Los Amigos - Dual Immersion | 51% | Palmdale Elementary | Antelope Valley | 74% | |
| 95 | 94 | Arroyo Seco Museum Science | 51% | Los Angeles Unified | Northeast L.A. | 76% | |
| 96 | 95 | Carpenter (C. C.) Elementary | 51% | Downey Unified | Southeast | 73% | |
| 97 | 96 | Golden Springs Elementary | 51% | Pomona Unified | San Gabriel Valley | 53% | |
| 98 | 97 | Dr. J. Michael McGrath Elementary | 51% | Newhall | Northwest County | 73% | |
| 99 | 98 | Sierra Vista Elementary | 51% | Los Angeles Unified | Eastside | 78% | |
| 100 | 99 | Ceres Elementary | 50% | East Whittier City Elementary | Southeast | 69% | |
| 101 | 100 | Cypress Elementary | 50% | Covina-Valley Unified | San Gabriel Valley | 71% | |
| 102 | 101 | William Anderson Elementary | 50% | Lawndale Elementary | South Bay | 67% | |
| 103 | 102 | Moffett Elementary | 50% | Lennox | South Bay | 88% | |
| 104 | 103 | Harry Bridges Span | 50% | Los Angeles Unified | Harbor | 91% | |
| 105 | 104 | Los Feliz Science/Tech/Engineer/Math/Medicine Magnet | 50% | Los Angeles Unified | Central L.A. | 48% | |
| 106 | 105 | Lafayette Elementary | 50% | Long Beach Unified | Harbor | 66% | |
| 107 | 106 | Everest Value (Charter) | 50% | Los Angeles Unified | Central L.A. | 92% | Value Schools |
| 108 | 107 | Cedarlane Academy | 50% | Hacienda la Puente Unified | San Gabriel Valley | 55% | |
| 109 | 108 | Ramona | 50% | Hawthorne | South Bay | 59% | |
| 110 | 109 | Dolores Huerta Elementary | 50% | Lennox | South Bay | 94% | |
| 111 | 110 | Rio San Gabriel Elementary | 50% | Downey Unified | Southeast | 55% | |
| 112 | 111 | One Hundred Eighty-Sixth Street Elementary | 50% | Los Angeles Unified | Harbor | 58% | |
| 113 | 112 | Furgeson (Venn W.) Elementary | 50% | ABC Unified | Harbor | 94% | |
| 114 | 113 | Legore Elementary | 50% | El Monte City | San Gabriel Valley | 81% | |
| 115 | 114 | Towne Avenue Elementary | 49% | Los Angeles Unified | Harbor | 63% | |
| 116 | 115 | ICEF Vista Elementary Academy (Charter) | 49% | Los Angeles Unified | Westside | 95% | ICEF Public Schools |
| 117 | 116 | Dyer Street Elementary | 49% | Los Angeles Unified | San Fernando Valley | 86% | |
| 118 | 117 | Marvin Elementary | 49% | Los Angeles Unified | South L.A. | 84% | |
| 119 | 118 | Chavez Elementary | 49% | Long Beach Unified | Harbor | 63% | |
| 120 | 119 | Lydia Jackson Elementary | 49% | Whittier City Elementary | San Gabriel Valley | 83% | |
| 121 | 120 | Downtown Value (Charter) | 49% | Los Angeles Unified | South L.A. | 93% | Value Schools |
| 122 | 121 | Lucille J. Smith Elementary | 49% | Lawndale Elementary | South Bay | 60% | |
| 123 | 122 | Grovecenter Elementary | 49% | Covina-Valley Unified | San Gabriel Valley | 57% | |
| 124 | 123 | Washington Elementary | 49% | Lynwood Unified | Southeast | 89% | |
| 125 | 124 | McKinley Elementary | 49% | Long Beach Unified | Harbor | 70% | |
| 126 | 125 | El Sereno Elementary | 49% | Los Angeles Unified | Eastside | 86% | |
| 127 | 126 | Wilshire Park Elementary | 49% | Los Angeles Unified | Central L.A. | 63% |
Top Public Schools for Low-income Latino Students in Math
| wdt_ID | School | % Low-income Latino proficient in math | District | Region | Low-income Latino % in school | Charter school network | |
|---|---|---|---|---|---|---|---|
| 1 | 1 | KIPP Raices Academy (Charter) | 78% | Los Angeles Unified | Eastside | 87% | KIPP LA Schools |
| 2 | 2 | Brainard Elementary | 73% | Los Angeles Unified | San Fernando Valley | 55% | |
| 3 | 3 | KIPP Iluminar Academy (Charter) | 72% | Los Angeles Unified | Eastside | 88% | KIPP LA Schools |
| 4 | 4 | KIPP Comienza Community Prep (Charter) | 69% | Los Angeles Unified | Southeast | 92% | KIPP LA Schools |
| 5 | 5 | Libertas College Preparatory Charter (Charter) | 68% | Los Angeles Unified | South L.A. | 70% | Building Excellent Schools |
| 6 | 6 | Ward (E. W.) Elementary | 68% | Downey Unified | Southeast | 78% | |
| 7 | 7 | Daniel Phelan Elementary | 67% | Whittier City Elementary | Southeast | 73% | |
| 8 | 8 | San Jose Charter Academy (Charter) | 64% | West Covina Unified | San Gabriel Valley | 44% | |
| 9 | 9 | McKinley Elementary | 64% | Compton Unified | Southeast | 56% | |
| 10 | 10 | Equitas Academy Charter (Charter) | 61% | Los Angeles Unified | Central L.A. | 93% | Equitas Academy Charter School, Inc. |
| 11 | 11 | Unsworth (Edith) Elementary | 61% | Downey Unified | Southeast | 68% | |
| 12 | 12 | Jefferson Elementary | 61% | Compton Unified | South L.A. | 88% | |
| 13 | 13 | Delevan Drive Elementary | 61% | Los Angeles Unified | Northeast L.A. | 44% | |
| 14 | 14 | Alvarado Elementary | 59% | Long Beach Unified | Harbor | 43% | |
| 15 | 15 | Aspire Juanita Tate Academy Charter (Charter) | 59% | Los Angeles Unified | South L.A. | 91% | Aspire Public Schools |
| 16 | 16 | Chapman Elementary | 58% | Los Angeles Unified | South Bay | 56% | |
| 17 | 17 | Clifford Street Elementary | 58% | Los Angeles Unified | Central L.A. | 61% | |
| 18 | 18 | Gabriella Charter (Charter) | 58% | Los Angeles Unified | Central L.A. | 79% | Gabriella Charter Schools |
| 19 | 19 | Ceres Elementary | 58% | East Whittier City Elementary | Southeast | 69% | |
| 20 | 20 | Synergy Charter Academy (Charter) | 58% | Los Angeles Unified | South L.A. | 94% | Synergy Academies |
| 21 | 21 | Hoover Street Elementary | 57% | Los Angeles Unified | Central L.A. | 90% | |
| 22 | 22 | PUC Milagro Charter (Charter) | 57% | Los Angeles Unified | Eastside | 91% | PUC Schools |
| 23 | 23 | Global Education Academy (Charter) | 56% | Los Angeles Unified | South L.A. | 96% | Global Education Collaborative |
| 24 | 24 | Stagg Street Elementary | 56% | Los Angeles Unified | San Fernando Valley | 65% | |
| 25 | 25 | New Heights Charter (Charter) | 56% | Los Angeles Unified | South L.A. | 77% | |
| 26 | 26 | Valley View Community Elementary | 56% | Sulphur Springs Union | Northwest County | 57% | |
| 27 | 27 | Wesley Gaines | 55% | Paramount Unified | Southeast | 86% | |
| 28 | 28 | J. Marion Roynon Elementary | 55% | Bonita Unified | Pomona Valley | 45% | |
| 29 | 29 | Abraham Lincoln | 54% | Paramount Unified | Southeast | 88% | |
| 30 | 30 | Jefferson Elementary | 54% | Paramount Unified | Southeast | 82% | |
| 31 | 31 | Vena Avenue Elementary | 54% | Los Angeles Unified | San Fernando Valley | 72% | |
| 32 | 32 | Bryson Avenue Elementary | 54% | Los Angeles Unified | Southeast | 82% | |
| 33 | 33 | Allesandro Elementary | 53% | Los Angeles Unified | Central L.A. | 71% | |
| 34 | 34 | Robert Hill Lane Elementary | 53% | Los Angeles Unified | San Gabriel Valley | 84% | |
| 35 | 35 | Lucille J. Smith Elementary | 53% | Lawndale Elementary | South Bay | 60% | |
| 36 | 36 | Chavez Elementary | 52% | Long Beach Unified | Harbor | 63% | |
| 37 | 37 | Mark Twain Elementary | 52% | Lawndale Elementary | South Bay | 49% | |
| 38 | 38 | Lincoln Elementary | 52% | Long Beach Unified | Harbor | 77% | |
| 39 | 39 | Harry Bridges Span | 52% | Los Angeles Unified | Harbor | 91% | |
| 40 | 40 | Lewis (Ed C.) Elementary | 52% | Downey Unified | Southeast | 63% | |
| 41 | 41 | Merced Elementary | 52% | West Covina Unified | San Gabriel Valley | 54% | |
| 42 | 42 | Jefferson | 52% | Hawthorne | South Bay | 71% | |
| 43 | 43 | Queen Anne Place Elementary | 51% | Los Angeles Unified | Central L.A. | 80% | |
| 44 | 44 | Price (Maude) Elementary | 51% | Downey Unified | Southeast | 62% | |
| 45 | 45 | Potrero Heights Elementary | 51% | Montebello Unified | Southeast | 47% | |
| 46 | 46 | Julia B. Morrison Elementary | 50% | Norwalk-La Mirada Unified | Southeast | 73% | |
| 47 | 47 | Lakeland Elementary | 50% | Little Lake City Elementary | Southeast | 70% | |
| 48 | 48 | Signal Hill Elementary | 50% | Long Beach Unified | Harbor | 49% | |
| 49 | 49 | Victoria Avenue Elementary | 50% | Los Angeles Unified | Southeast | 87% | |
| 50 | 50 | Buford Elementary | 50% | Lennox | South Bay | 88% | |
| 51 | 51 | McKinley Elementary | 50% | Long Beach Unified | Harbor | 70% | |
| 52 | 52 | Newhall Elementary | 50% | Newhall | Northwest County | 91% | |
| 53 | 53 | New Temple | 49% | Valle Lindo Elementary | San Gabriel Valley | 81% | |
| 54 | 54 | One Hundred Eighteenth Street | 49% | Los Angeles Unified | South L.A. | 72% | |
| 55 | 55 | KIPP Vida Preparatory Academy (Charter) | 49% | Los Angeles Unified | South L.A. | 61% | KIPP LA Schools |
| 56 | 56 | ICEF Vista Elementary Academy (Charter) | 49% | Los Angeles Unified | Westside | 95% | ICEF Public Schools |
| 57 | 57 | Barranca Elementary | 48% | Covina-Valley Unified | San Gabriel Valley | 56% | |
| 58 | 58 | Lafayette Elementary | 48% | Long Beach Unified | Harbor | 66% | |
| 59 | 59 | Aspire Antonio Maria Lugo Academy (Charter) | 48% | Los Angeles County Office of Education | Southeast | 94% | Aspire Public Schools |
| 60 | 60 | Wallen L. Andrews Elementary | 48% | Whittier City Elementary | San Gabriel Valley | 53% | |
| 61 | 61 | ISANA Palmati Academy (Charter) | 48% | Los Angeles Unified | San Fernando Valley | 84% | Celerity Educational Group |
| 62 | 62 | Toluca Lake Elementary | 48% | Los Angeles Unified | San Fernando Valley | 61% | |
| 63 | 63 | Watts Learning Center (Charter) | 47% | Los Angeles Unified | South L.A. | 48% | Watts Learning Center |
| 64 | 64 | Celerity Rolas Charter (Charter) | 47% | SBE - Celerity Rolas | Northeast L.A. | 64% | Celerity Educational Group |
| 65 | 65 | Los Feliz Science/Tech/Engineer/Math/Medicine Magnet | 47% | Los Angeles Unified | Central L.A. | 48% | |
| 66 | 66 | Jersey Avenue Elementary | 47% | Little Lake City Elementary | Southeast | 66% | |
| 67 | 67 | Edgewood Academy | 47% | Bassett Unified | San Gabriel Valley | 79% | |
| 69 | 68 | Today's Fresh Start Charter School Inglewood (Charter) | 47% | Inglewood Unified | South Bay | 46% | Today's Fresh Start Public Charter Schools |
| 70 | 69 | Aspire Gateway Academy Charter (Charter) | 47% | Los Angeles Unified | Southeast | 93% | Aspire Public Schools |
| 71 | 70 | Rowland Avenue Elementary | 47% | Covina-Valley Unified | San Gabriel Valley | 60% | |
| 72 | 71 | N.E.W. Academy of Science and Arts (Charter) | 47% | Los Angeles Unified | Central L.A. | 98% | NEW Academy Charter Schools |
| 73 | 72 | Towne Avenue Elementary | 46% | Los Angeles Unified | Harbor | 63% | |
| 74 | 73 | Mill Elementary | 46% | Whittier City Elementary | San Gabriel Valley | 63% | |
| 75 | 74 | William W. Orr Elementary | 46% | Little Lake City Elementary | Southeast | 70% | |
| 76 | 75 | California Elementary | 46% | Hacienda la Puente Unified | San Gabriel Valley | 84% | |
| 77 | 76 | Aspire Titan Academy (Charter) | 45% | Los Angeles Unified | Southeast | 96% | Aspire Public Schools |
| 78 | 77 | Roosevelt Elementary | 45% | Long Beach Unified | San Gabriel Valley | 80% | |
| 79 | 78 | Don Julian Elementary | 45% | Bassett Unified | San Gabriel Valley | 91% | |
| 80 | 79 | Anderson Elementary | 45% | Compton Unified | South L.A. | 82% | |
| 81 | 80 | Brooklyn Avenue Elementary | 45% | Los Angeles Unified | Eastside | 93% | |
| 82 | 81 | Park Elementary | 45% | Alhambra Unified | San Gabriel Valley | 44% | |
| 83 | 82 | Hollydale | 45% | Paramount Unified | Southeast | 88% | |
| 84 | 83 | Vista del Valle Elementary | 45% | Claremont Unified | Pomona Valley | 54% | |
| 85 | 84 | Foster Road Elementary | 45% | Norwalk-La Mirada Unified | Southeast | 71% | |
| 86 | 85 | One Hundred Twenty-Second Street Elementary | 45% | Los Angeles Unified | South L.A. | 77% | |
| 87 | 86 | Mayall Street Elementary | 45% | Los Angeles Unified | San Fernando Valley | 48% | |
| 88 | 87 | Peachland Avenue Elementary | 45% | Newhall | Northwest County | 53% | |
| 89 | 88 | Kenmore Elementary | 44% | Baldwin Park Unified | San Gabriel Valley | 84% | |
| 90 | 89 | Latona Avenue Elementary | 44% | Los Angeles Unified | Northeast L.A. | 86% | |
| 91 | 90 | Mint Canyon Community Elementary | 44% | Sulphur Springs Union | Northwest County | 69% | |
| 92 | 91 | Rio San Gabriel Elementary | 44% | Downey Unified | Southeast | 55% | |
| 93 | 92 | Mayo Elementary | 44% | Compton Unified | Southeast | 81% | |
| 94 | 93 | ISANA Octavia Academy (Charter) | 44% | Los Angeles Unified | Northeast L.A. | 76% | Celerity Educational Group |
| 95 | 94 | Westside Global Awareness Magnet | 44% | Los Angeles Unified | Westside | 57% | |
| 96 | 95 | Lakeview Elementary | 44% | Little Lake City Elementary | Southeast | 62% | |
| 97 | 96 | Ramona | 44% | Hawthorne | South Bay | 59% | |
| 98 | 97 | Yorkdale Elementary | 44% | Los Angeles Unified | Northeast L.A. | 81% | |
| 99 | 98 | Williams (Spencer V.) Elementary | 44% | Downey Unified | Southeast | 64% | |
| 100 | 99 | Two Hundred Thirty-Second Place | 43% | Los Angeles Unified | Harbor | 44% | |
| 101 | 100 | King Elementary | 43% | Long Beach Unified | Harbor | 72% | |
| 102 | 101 | Fifteenth Street Elementary | 43% | Los Angeles Unified | Harbor | 78% | |
| 103 | 102 | Bella Vista Elementary | 43% | Montebello Unified | San Gabriel Valley | 64% | |
| 104 | 103 | Studebaker Elementary | 43% | Little Lake City Elementary | Southeast | 62% | |
| 105 | 104 | Maywood Elementary | 43% | Los Angeles Unified | Southeast | 88% | |
| 106 | 105 | Paddison Elementary | 43% | Little Lake City Elementary | Southeast | 68% | |
| 107 | 106 | Wiley Canyon Elementary | 43% | Newhall | Northwest County | 71% | |
| 108 | 107 | Haskell Elementary STEAM Magnet | 43% | Los Angeles Unified | San Fernando Valley | 56% | |
| 109 | 108 | Clinton, William Jefferson | 43% | Compton Unified | Southeast | 83% | |
| 110 | 109 | Halldale Elementary | 43% | Los Angeles Unified | Harbor | 70% | |
| 111 | 110 | Extera Public School No. 2 (Charter) | 43% | Los Angeles Unified | Eastside | 95% | Extera Public Schools |
| 112 | 111 | Park Western Place Elementary | 43% | Los Angeles Unified | Harbor | 44% | |
| 113 | 112 | Grovecenter Elementary | 43% | Covina-Valley Unified | San Gabriel Valley | 57% | |
| 114 | 113 | Paramount Elementary | 43% | Azusa Unified | San Gabriel Valley | 89% | |
| 115 | 114 | Jenny Oropeza Elementary | 42% | Long Beach Unified | Harbor | 76% | |
| 116 | 115 | Alice M. Ellington Elementary | 42% | Azusa Unified | San Gabriel Valley | 71% | |
| 117 | 116 | ISANA Achernar Academy (Charter) | 42% | Compton Unified | Southeast | 58% | Celerity Educational Group |
| 118 | 117 | Merlinda Elementary | 42% | West Covina Unified | San Gabriel Valley | 60% | |
| 119 | 118 | Golden Springs Elementary | 42% | Pomona Unified | San Gabriel Valley | 53% | |
| 120 | 119 | Menlo Avenue Elementary | 42% | Los Angeles Unified | South L.A. | 85% | |
| 121 | 120 | Twentieth Street Elementary | 42% | Los Angeles Unified | South L.A. | 92% | |
| 122 | 121 | Washington | 42% | Hawthorne | South Bay | 70% | |
| 123 | 122 | Dyer Street Elementary | 42% | Los Angeles Unified | San Fernando Valley | 86% | |
| 124 | 123 | Charles H. Lee Elementary | 42% | Azusa Unified | San Gabriel Valley | 90% |
MIDDLE SCHOOLS
These schools are closing achievement gaps and setting students on a path to college
Top Public Schools for Low-income African American Students in English
| wdt_ID | School | % Low-income African American proficient in English | District | Region | Low-income African American % in school | Charter school network | |
|---|---|---|---|---|---|---|---|
| 1 | 1 | Richard Henry Dana Middle | 76% | Wiseburn Unified | South Bay | 7% | |
| 2 | 2 | WISH Community (Charter) | 74% | Los Angeles Unified | South Bay | 11% | |
| 3 | 3 | Wilder's Preparatory Academy Charter Middle (Charter) | 70% | Inglewood Unified | South Bay | 54% | Wilder's Preparatory Academies |
| 4 | 4 | Culver City Middle | 58% | Culver City Unified | Westside | 7% | |
| 5 | 5 | Laurel Street Elementary | 58% | Compton Unified | Southeast | 15% | |
| 6 | 6 | Philip Magruder Middle | 53% | Torrance Unified | South Bay | 4% | |
| 7 | 7 | Jane Addams Middle | 51% | Lawndale Elementary | South Bay | 5% | |
| 8 | 8 | ISANA Achernar Academy (Charter) | 50% | Compton Unified | Southeast | 40% | Celerity Educational Group |
| 10 | 9 | Today's Fresh Start-Compton (Charter) | 49% | Compton Unified | South L.A. | 50% | Today's Fresh Start Public Charter Schools |
Top Public Schools for Low-income African American Students in Math
| wdt_ID | School | % Low-income African American proficient in Math | District | Region | Low-income African American % in school | Charter school network | |
|---|---|---|---|---|---|---|---|
| 1 | 1 | Richard Henry Dana Middle | 50% | Wiseburn Unified | South Bay | 7% | |
| 2 | 2 | Wilder's Preparatory Academy Charter Middle (Charter) | 44% | Inglewood Unified | South Bay | 54% | Wilder's Preparatory Academies |
| 3 | 3 | WISH Community (Charter) | 43% | Los Angeles Unified | South Bay | 11% | |
| 4 | 4 | ISANA Achernar Academy (Charter) | 42% | Compton Unified | Southeast | 40% | Celerity Educational Group |
| 6 | 5 | Today's Fresh Start-Compton (Charter) | 41% | Compton Unified | South L.A. | 50% | Today's Fresh Start Public Charter Schools |
Top Public Schools for Low-income Latino Students in English
| wdt_ID | School | % Low-income Latino proficient in English | District | Region | Low-income Latino % in school | Charter school network | |
|---|---|---|---|---|---|---|---|
| 1 | 1 | KIPP Los Angeles College Preparatory (Charter) | 71% | Los Angeles Unified | Eastside | 91% | KIPP LA Schools |
| 2 | 2 | Gabriella Charter (Charter) | 71% | Los Angeles Unified | Central L.A. | 79% | Gabriella Charter Schools |
| 3 | 3 | San Jose Charter Academy (Charter) | 68% | West Covina Unified | San Gabriel Valley | 44% | |
| 4 | 4 | Brooklyn Avenue Elementary | 67% | Los Angeles Unified | Eastside | 93% | |
| 5 | 5 | Anderson Elementary | 67% | Compton Unified | South L.A. | 82% | |
| 6 | 6 | Muir K-8 | 66% | Long Beach Unified | Harbor | 56% | |
| 7 | 7 | Santa Fe Fundamental | 65% | Baldwin Park Unified | San Gabriel Valley | 68% | |
| 8 | 8 | KIPP Sol Academy (Charter) | 63% | Los Angeles Unified | Eastside | 86% | KIPP LA Schools |
| 9 | 9 | Jefferson Elementary | 63% | Compton Unified | South L.A. | 88% | |
| 10 | 10 | ISANA Palmati Academy (Charter) | 62% | Los Angeles Unified | San Fernando Valley | 84% | Celerity Educational Group |
| 11 | 11 | KIPP Academy of Innovation (Charter) | 59% | Los Angeles Unified | Eastside | 91% | KIPP LA Schools |
| 12 | 12 | Clinton, William Jefferson | 59% | Compton Unified | Southeast | 83% | |
| 13 | 13 | New Heights Charter (Charter) | 59% | Los Angeles Unified | South L.A. | 77% | |
| 14 | 14 | Monte Vista Elementary | 59% | Mountain View Elementary | San Gabriel Valley | 87% | |
| 15 | 15 | Laurel Street Elementary | 58% | Compton Unified | Southeast | 65% | |
| 16 | 16 | Libertas College Preparatory Charter (Charter) | 57% | Los Angeles Unified | South L.A. | 70% | Building Excellent Schools |
| 17 | 17 | Lakeside Middle | 57% | Little Lake City Elementary | Southeast | 68% | |
| 18 | 18 | Environmental Charter Middle - Inglewood (Charter) | 57% | Los Angeles County Office of Education | South Bay | 80% | Environmental Charter Schools |
| 19 | 19 | Harry Bridges Span | 56% | Los Angeles Unified | Harbor | 91% | |
| 21 | 20 | Aspire Centennial College Preparatory Academy (Charter) | 55% | Los Angeles Unified | Southeast | 90% | Aspire Public Schools |
| 22 | 21 | Maywood Center for Enriched Studies | 55% | Los Angeles Unified | Southeast | 91% | |
| 25 | 22 | Today's Fresh Start Charter School Inglewood (Charter) | 55% | Inglewood Unified | South Bay | 46% | Today's Fresh Start Public Charter Schools |
| 26 | 23 | Lake Center Middle | 55% | Little Lake City Elementary | Southeast | 65% | |
| 27 | 24 | Glenn Hammond Curtiss Middle | 54% | Los Angeles Unified | Harbor | 46% | |
| 28 | 25 | Park Elementary | 54% | Alhambra Unified | San Gabriel Valley | 44% | |
| 30 | 26 | James Jordan Middle (Charter) | 53% | Los Angeles Unified | San Fernando Valley | 86% | |
| 31 | 27 | Los Amigos - Dual Immersion | 53% | Palmdale Elementary | Antelope Valley | 74% | |
| 32 | 28 | Westside Global Awareness Magnet | 53% | Los Angeles Unified | Westside | 57% | |
| 33 | 29 | Durfee Elementary | 53% | El Monte City | San Gabriel Valley | 69% | |
| 34 | 30 | Wallen L. Andrews Elementary | 52% | Whittier City Elementary | San Gabriel Valley | 53% | |
| 36 | 31 | East Whittier Middle | 52% | East Whittier City Elementary | San Gabriel Valley | 54% | |
| 37 | 32 | STEAM Academy @ Burke | 52% | El Rancho Unified | Southeast | 70% | |
| 38 | 33 | Kelly Elementary | 51% | Compton Unified | Southeast | 79% | |
| 39 | 34 | Columbia Elementary | 51% | El Monte City | San Gabriel Valley | 89% | |
| 40 | 35 | PUC Triumph Charter Academy and Charter High (Charter) | 51% | Los Angeles Unified | San Fernando Valley | 84% | PUC Schools |
| 41 | 36 | Dean L. Shively | 51% | Valle Lindo Elementary | San Gabriel Valley | 80% | |
| 42 | 37 | Walnut Grove Intermediate | 51% | West Covina Unified | San Gabriel Valley | 63% | |
| 43 | 38 | Fairgrove Academy | 50% | Hacienda la Puente Unified | San Gabriel Valley | 76% | |
| 44 | 39 | Jane Addams Middle | 50% | Lawndale Elementary | South Bay | 70% | |
| 45 | 40 | Alliance Gertz-Ressler Richard Merkin 6-12 Complex (Charter) | 49% | Los Angeles Unified | South L.A. | 96% | Alliance College-Ready Public Schools |
| 46 | 41 | Aspire Pacific Academy (Charter) | 49% | Los Angeles Unified | Southeast | 94% | Aspire Public Schools |
| 47 | 42 | Wright Elementary | 49% | El Monte City | San Gabriel Valley | 73% | |
| 48 | 43 | Magnolia Science Academy 5 (Charter) | 49% | Los Angeles Unified | San Fernando Valley | 76% | Magnolia Educational and Research Foundation |
| 50 | 44 | Los Nietos Middle | 49% | Los Nietos | Southeast | 82% |
Top Public Schools for Low-income Latino Students in Math
| wdt_ID | School | % Low-income Latino proficient in English | District | Region | Low-income Latino % in school | Charter school network | |
|---|---|---|---|---|---|---|---|
| 1 | 1 | KIPP Los Angeles College Preparatory (Charter) | 70% | Los Angeles Unified | Eastside | 91% | KIPP LA Schools |
| 2 | 2 | Brooklyn Avenue Elementary | 64% | Los Angeles Unified | Eastside | 93% | |
| 3 | 3 | San Jose Charter Academy (Charter) | 59% | West Covina Unified | San Gabriel Valley | 44% | |
| 4 | 4 | Gabriella Charter (Charter) | 59% | Los Angeles Unified | Central L.A. | 79% | Gabriella Charter Schools |
| 5 | 5 | Anderson Elementary | 57% | Compton Unified | South L.A. | 82% | |
| 6 | 6 | James Jordan Middle (Charter) | 53% | Los Angeles Unified | San Fernando Valley | 86% | |
| 7 | 7 | KIPP Academy of Innovation (Charter) | 52% | Los Angeles Unified | Eastside | 91% | KIPP LA Schools |
| 8 | 8 | KIPP Sol Academy (Charter) | 52% | Los Angeles Unified | Eastside | 86% | KIPP LA Schools |
| 9 | 9 | Libertas College Preparatory Charter (Charter) | 49% | Los Angeles Unified | South L.A. | 70% | Building Excellent Schools |
| 10 | 10 | Muir K-8 | 48% | Long Beach Unified | Harbor | 56% | |
| 11 | 11 | Lexington Elementary | 47% | Pomona Unified | Pomona Valley | 90% | |
| 12 | 12 | Edgewood Academy | 47% | Bassett Unified | San Gabriel Valley | 79% | |
| 13 | 13 | Clinton, William Jefferson | 47% | Compton Unified | Southeast | 83% | |
| 14 | 14 | ISANA Palmati Academy (Charter) | 46% | Los Angeles Unified | San Fernando Valley | 84% | Celerity Educational Group |
| 15 | 15 | Jefferson Elementary | 44% | Compton Unified | South L.A. | 88% | |
| 16 | 16 | Washington Middle | 43% | Long Beach Unified | Harbor | 81% | |
| 17 | 17 | New Heights Charter (Charter) | 43% | Los Angeles Unified | South L.A. | 77% | |
| 18 | 18 | Tibby Elementary | 42% | Compton Unified | Southeast | 48% | |
| 19 | 19 | Everest Value (Charter) | 42% | Los Angeles Unified | Central L.A. | 92% | Value Schools |
| 20 | 20 | ISANA Octavia Academy (Charter) | 42% | Los Angeles Unified | Northeast L.A. | 76% | Celerity Educational Group |
| 21 | 21 | Fairgrove Academy | 42% | Hacienda la Puente Unified | San Gabriel Valley | 76% | |
| 22 | 22 | Alliance College-Ready Middle Academy 12 (Charter) | 41% | Los Angeles Unified | South L.A. | 94% | Alliance College-Ready Public Schools |
| 23 | 23 | Washington Irving Middle School Math, Music and Engineering Magnet | 41% | Los Angeles Unified | Northeast L.A. | 76% | |
| 24 | 24 | Monte Vista Elementary | 41% | Mountain View Elementary | San Gabriel Valley | 87% | |
| 25 | 25 | Equitas Academy #2 (Charter) | 41% | Los Angeles Unified | Central L.A. | 95% | Equitas Academy Charter School, Inc. |
| 26 | 26 | Harry Bridges Span | 40% | Los Angeles Unified | Harbor | 91% | |
| 27 | 27 | Kelly Elementary | 39% | Compton Unified | Southeast | 79% | |
| 28 | 28 | ISANA Achernar Academy (Charter) | 38% | Compton Unified | Southeast | 58% | Celerity Educational Group |
| 29 | 29 | Hollencrest Middle | 37% | West Covina Unified | San Gabriel Valley | 51% | |
| 30 | 30 | Katherine Edwards Middle | 37% | Whittier City Elementary | Southeast | 78% | |
| 31 | 31 | Lake Center Middle | 37% | Little Lake City Elementary | Southeast | 65% |
HIGH SCHOOLS
These schools are closing achievement gaps and setting students on a path to college
Top Public Schools for Low-income African American Students
| wdt_ID | School | % Low-income African American UC/CSU eligibilty | % Low-income African American proficient in English | % Low-income African American proficient in math | District | Region | Low-income African American % in school | Charter school network | |
|---|---|---|---|---|---|---|---|---|---|
| 1 | 1 | King/Drew Medical Magnet High | 71% | 61% | 29% | Los Angeles Unified | South L.A. | 35% | |
| 2 | 2 | CATCH Prep Charter High, Inc. (Charter) | 97% | 58% | 25% | Los Angeles Unified | South L.A. | 73% | |
| 3 | 3 | Hollywood Senior High | 53% | 56% | 16% | Los Angeles Unified | Central L.A. | 9% |
Top Public Schools for Low-income Latino Students
| wdt_ID | School | % low-income Latino UC/CSU eligibility | % Low-income Latino proficient in English | % Low-income Latino proficient in math | District | Region | Low-income Latino % in school | Charter school network | |
|---|---|---|---|---|---|---|---|---|---|
| 1 | 1 | Magnolia Science Academy (Charter) | 86% | 59% | 41% | Los Angeles County Office of Education | San Fernando Valley | 84% | Magnolia Educational and Research Foundation |
| 2 | 2 | Alliance Cindy and Bill Simon Technology Academy High (Charter) | 100% | 64% | 22% | Los Angeles Unified | South L.A. | 89% | Alliance College-Ready Public Schools |
| 3 | 3 | Alliance Collins Family College-Ready High (Charter) | 99% | 68% | 34% | Los Angeles Unified | Southeast | 95% | Alliance College-Ready Public Schools |
| 4 | 4 | Lennox Mathematics, Science and Technology Academy (Charter) | 72% | 71% | 45% | Lennox | South Bay | 60% | |
| 5 | 5 | Alliance Judy Ivie Burton Technology Academy High (Charter) | 95% | 81% | 48% | Los Angeles Unified | South L.A. | 96% | Alliance College-Ready Public Schools |
| 6 | 6 | Hawthorne Math and Science Academy (Charter) | 70% | 90% | 72% | Hawthorne | South Bay | 59% | |
| 7 | 7 | Foshay Learning Center | 81% | 61% | 20% | Los Angeles Unified | South L.A. | 76% | |
| 8 | 8 | Alliance Patti And Peter Neuwirth Leadership Academy (Charter) | 97% | 81% | 48% | Los Angeles Unified | South L.A. | 95% | Alliance College-Ready Public Schools |
| 9 | 9 | California High | 56% | 60% | 22% | Whittier Union High | Southeast | 71% | |
| 10 | 10 | Alliance Dr. Olga Mohan High (Charter) | 98% | 77% | 48% | Los Angeles Unified | Central L.A. | 90% | Alliance College-Ready Public Schools |
| 11 | 11 | Animo Leadership High (Charter) | 97% | 77% | 21% | Lennox | South Bay | 96% | Green Dot Public Schools |
| 12 | 12 | PUC CALS Middle School and Early College High (Charter) | 98% | 61% | 50% | Los Angeles Unified | San Fernando Valley | 79% | PUC Schools |
| 13 | 13 | Animo Inglewood Charter High (Charter) | 77% | 59% | 30% | Inglewood Unified | South Bay | 88% | Green Dot Public Schools |
| 14 | 14 | Daniel Pearl Journalism & Communications Magnet | 66% | 72% | 21% | Los Angeles Unified | San Fernando Valley | 43% | |
| 15 | 15 | El Rancho High | 53% | 57% | 26% | El Rancho Unified | Southeast | 70% | |
| 16 | 16 | Alliance Margaret M. Bloomfield Technology Academy High (Charter) | 97% | 85% | 24% | Los Angeles Unified | South L.A. | 93% | Alliance College-Ready Public Schools |
| 17 | 17 | Animo Pat Brown (Charter) | 71% | 60% | 24% | Los Angeles Unified | South L.A. | 98% | Green Dot Public Schools |
| 18 | 18 | Cesar E. Chavez Learning Academies-Social Justice Humanitas Academy | 93% | 64% | 23% | Los Angeles Unified | San Fernando Valley | 88% | |
| 19 | 19 | Whittier High | 54% | 57% | 31% | Whittier Union High | San Gabriel Valley | 73% | |
| 20 | 20 | Linda Esperanza Marquez High B LIBRA Academy | 77% | 66% | 30% | Los Angeles Unified | Southeast | 95% | |
| 21 | 21 | La Serna High | 55% | 59% | 27% | Whittier Union High | San Gabriel Valley | 45% | |
| 22 | 22 | Aspire Ollin University Preparatory Academy (Charter) | 97% | 74% | 48% | Los Angeles County Office of Education | Southeast | 96% | Aspire Public Schools |
| 23 | 23 | Marshall Fundamental | 54% | 58% | 19% | Pasadena Unified | Verdugos | 46% | |
| 24 | 24 | Magnolia Science Academy 3 (Charter) | 89% | 65% | 17% | Los Angeles County Office of Education | Harbor | 46% | Magnolia Educational and Research Foundation |
| 25 | 25 | Central City Value (Charter) | 73% | 68% | 24% | Los Angeles Unified | Central L.A. | 91% | Value Schools |
| 26 | 26 | Orthopaedic Hospital | 78% | 76% | 34% | Los Angeles Unified | South L.A. | 90% | |
| 27 | 27 | Santa Fe High | 56% | 57% | 34% | Whittier Union High | Southeast | 72% | |
| 28 | 28 | Alliance Ouchi-O'Donovan 6-12 Complex (Charter) | 96% | 65% | 37% | Los Angeles Unified | South L.A. | 90% | Alliance College-Ready Public Schools |
| 29 | 29 | Alliance Gertz-Ressler Richard Merkin 6-12 Complex (Charter) | 96% | 79% | 40% | Los Angeles Unified | South L.A. | 96% | Alliance College-Ready Public Schools |
| 30 | 30 | Alliance Marc & Eva Stern Math and Science (Charter) | 90% | 78% | 35% | Los Angeles Unified | Eastside | 84% | Alliance College-Ready Public Schools |
| 31 | 31 | STEM Academy at Bernstein High | 92% | 75% | 30% | Los Angeles Unified | Central L.A. | 83% | |
| 32 | 32 | Sun Valley Magnet | 63% | 63% | 46% | Los Angeles Unified | San Fernando Valley | 88% | |
| 33 | 33 | PUC Lakeview Charter High (Charter) | 95% | 65% | 42% | Los Angeles Unified | San Fernando Valley | 79% | PUC Schools |
| 34 | 34 | Ednovate - USC Hybrid High College Prep (Charter) | 95% | 81% | 47% | Los Angeles Unified | Central L.A. | 73% | Ednovate, Inc. |
| 35 | 35 | King/Drew Medical Magnet High | 77% | 79% | 50% | Los Angeles Unified | South L.A. | 54% | |
| 36 | 36 | Francisco Bravo Medical Magnet High | 73% | 88% | 48% | Los Angeles Unified | Eastside | 74% | |
| 37 | 37 | James A. Garfield Senior High | 63% | 64% | 39% | Los Angeles Unified | Eastside | 93% | |
| 38 | 38 | Alliance Leichtman-Levine Family Foundation Environmental Science High (Charter) | 93% | 59% | 26% | Los Angeles Unified | Northeast L.A. | 79% | Alliance College-Ready Public Schools |
| 39 | 39 | PUC Triumph Charter Academy and PUC Triumph Charter High (Charter) | 94% | 58% | 25% | Los Angeles Unified | San Fernando Valley | 84% | PUC Schools |
| 40 | 40 | International Studies Learning Center at Legacy High School Complex | 71% | 87% | 49% | Los Angeles Unified | Southeast | 91% | |
| 41 | 41 | Math, Science, & Technology Magnet Academy at Roosevelt High | 72% | 79% | 40% | Los Angeles Unified | Eastside | 93% | |
| 42 | 42 | Northridge Academy High | 51% | 59% | 17% | Los Angeles Unified | San Fernando Valley | 58% | |
| 43 | 43 | Alliance Renee and Meyer Luskin Academy High (Charter) | 92% | 59% | 33% | Los Angeles Unified | South L.A. | 81% | Alliance College-Ready Public Schools |
| 44 | 44 | North Hollywood Senior High | 52% | 60% | 21% | Los Angeles Unified | San Fernando Valley | 61% | |
| 45 | 45 | Downtown Business High | 66% | 86% | 62% | Los Angeles Unified | Central L.A. | 51% | |
| 46 | 46 | Environmental Charter High (Charter) | 91% | 63% | 30% | Lawndale Elementary | South Bay | 74% | Environmental Charter Schools |
| 47 | 47 | Animo Jackie Robinson High (Charter) | 68% | 57% | 31% | Los Angeles Unified | South L.A. | 96% | Green Dot Public Schools |
| 48 | 48 | TEACH Tech Charter High (Charter) | 86% | 69% | 26% | Los Angeles Unified | South L.A. | 59% | TEACH, Inc. |
| 49 | 49 | South East High | 54% | 66% | 25% | Los Angeles Unified | Southeast | 92% | |
| 50 | 50 | Lifeline Education Charter (Charter) | 89% | 56% | 19% | Compton Unified | Southeast | 84% | |
| 51 | 51 | PUC Early College Academy for Leaders and Scholars (ECALS) (Charter) | 87% | 58% | 39% | Los Angeles Unified | San Fernando Valley | 70% | PUC Schools |
| 52 | 52 | Math and Science College Preparatory (Charter) | 89% | 62% | 35% | Los Angeles Unified | South L.A. | 82% | STEM Preparatory Schools |
| 53 | 53 | Alliance Tennenbaum Family Technology High (Charter) | 84% | 64% | 38% | Los Angeles Unified | San Fernando Valley | 87% | Alliance College-Ready Public Schools |
| 54 | 54 | Linda Esperanza Marquez High C School of Social Justice | 55% | 68% | 22% | Los Angeles Unified | Southeast | 97% | |
| 55 | 55 | Cesar E. Chavez Learning Academies - Arts/Theatre/Entertain Mag | 82% | 70% | 35% | Los Angeles Unified | San Fernando Valley | 74% | |
| 56 | 56 | Linda Esperanza Marquez High A Huntington Park Institute of Applied Medicine | 61% | 68% | 28% | Los Angeles Unified | Southeast | 92% | |
| 57 | 57 | Science, Technology, Engineering, Arts and Mathematics at Legacy High School Complex | 65% | 63% | 26% | Los Angeles Unified | Southeast | 91% | |
| 58 | 58 | Public Service Community at Diego Rivera Learning Complex | 55% | 65% | 21% | Los Angeles Unified | South L.A. | 92% | |
| 59 | 59 | Hollywood Senior High | 64% | 60% | 25% | Los Angeles Unified | Central L.A. | 64% | |
| 60 | 60 | John Marshall Senior High | 59% | 60% | 22% | Los Angeles Unified | Central L.A. | 51% | |
| 61 | 61 | Alliance Alice M. Baxter College-Ready High (Charter) | 85% | 56% | 27% | Los Angeles Unified | Harbor | 71% | Alliance College-Ready Public Schools |
The 279 Top Public Schools in Los Angeles County span 45 districts from the Antelope Valley to the Harbor and the Westside to Pomona Valley.
Click the map to explore each school’s outcomes for low-income African American and Latino students.

×
Top Public Schools in Los Angeles County.
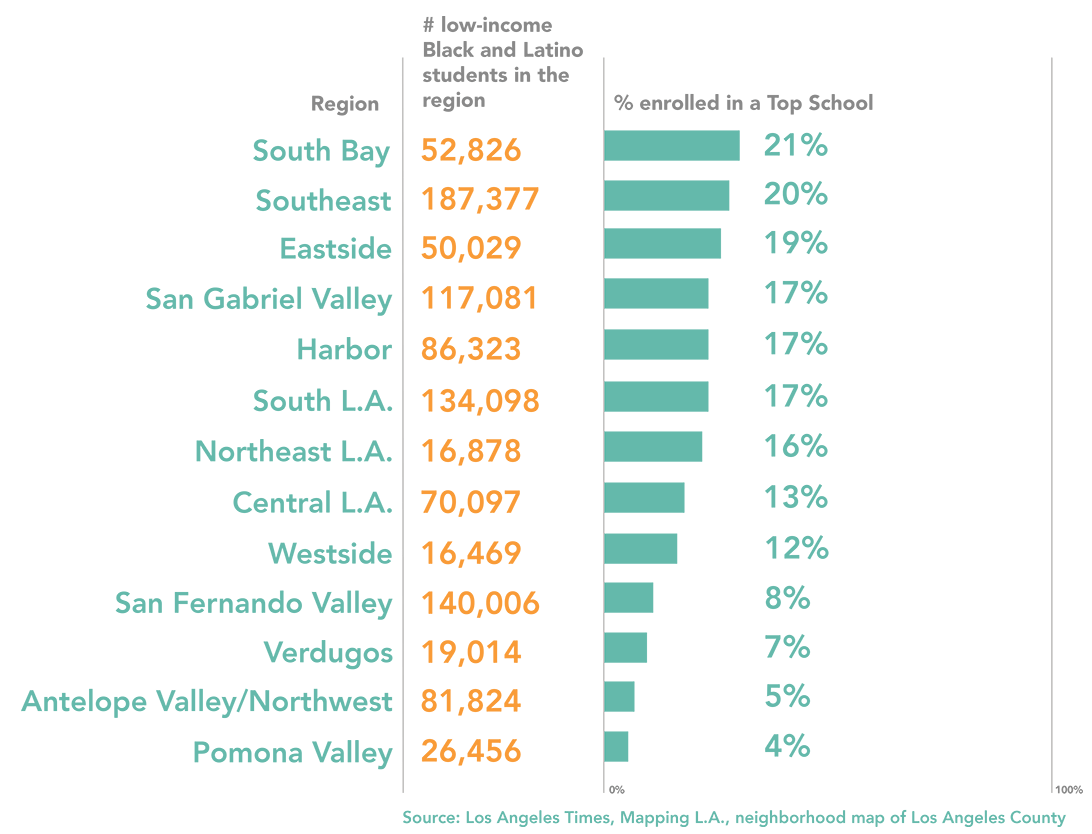
A regional look: some regions have a higher share of low-income Black and Latino students served by Top Public Schools
One million low-income Black and Latino students live across 14 regions in Los Angeles County. Access to Top Public Schools varies by region.
Top Public Schools are concentrated in the South Bay, Southeast, and Eastside. Low-income Black and Latino students in these three regions are more likely to attend a Top Public School than similar students in other regions of the county. For example, low-income Black and Latino students in these regions are two times more likely to attend a Top Public School than similar students that live in Central LA and the Westside.
What do these schools do differently?
There isn’t one single program or model that leads to the remarkable results these schools have accomplished. In fact, all school governance models — traditional district, charter, and other magnet or pilot models — are represented in this report. Innovate Public Schools has studied high-performing schools across the country and found that they are as diverse as the communities they serve. However, we found that many of the schools on this list do share certain core school-wide practices and beliefs that distinguish them from other schools.
Our World-class Schools Framework outlines these practices. We partnered with the USC Price Center for Social Innovation and the USC Center on Education Policy, Equity and Governance to profile two schools from this year’s Top Public Schools list. Below we highlight schools that show what these practices look like in action:
Brooklyn Avenue Elementary
Learn more +KIPP Los Angeles College Preparatory
Learn more +Signal Hill Elementary
Learn more +Alliance Patti & Peter Neuwirth Leadership Academy
Learn more +King/Drew Medical Magnet High
Learn more +How we identify Top Public Schools
Our annual Top Public Schools report examines how well schools in Los Angeles County are preparing students for the futures they choose. We consider multiple factors, including math and reading scores, college eligibility data, and suspension data to identify schools that are closing the achievement gap and ensuring students, regardless of race or income, are on track for college.
How schools are included on the list
In order to make our list as a Top Public School for low-income Latino or low-income African American students, schools must meet the following inclusion criteria:
- Schools must successfully close the achievement gap for underserved students. The school’s proficiency rates in English and/or math for these two student groups have to be at or above the statewide proficiency rate for all students in English and/or math in a given school type (elementary, middle, or high).
- High schools must demonstrate that they are preparing underserved students of color for college. Schools’ graduation and UC/CSU eligibility rates for low-income Latino and low-income African American students must be at or above the statewide average for all students.
- Schools have to test at least 95% of their students. Schools also have to have at least 20 students tested in the given student group and subject in order to be considered. This is key to ensuring their data paints a true picture of their performance and how well they’re serving all of their students.
- Schools have to enroll a representative proportion of underserved students. Schools must enroll at least 4% low-income African American students and/or at least 43% low-income Latino students, which are the statewide enrollment averages, in order to be considered. In Los Angeles county, there are 1,318 schools serving at least 43% low-income Latino students and 711 schools serving at least 4% low-income African American students.
How schools get removed from the list
After identifying schools that meet the set of inclusion criteria outlined above, we eliminate schools that meet one or more of the following exclusion criteria:

- Schools with low academic performance on the California Dashboard. We eliminate schools that performed poorly on the California Dashboard’s Academic indicator for the African American or Latino subgroup. Like proficiency rates, this indicator is based on student results on state exams. However, it also measures how a school improved from one year to the next overall, and it measures how far every single student is from mastering the standards.
- Schools with high suspension rates. We eliminate schools that have high suspension rates (as indicated by “red” performance or “very high status” on the California Dashboard Suspension Rate indicator) for either all students or for the given group of students. High suspension rates can serve as an important indicator that a school has more work to do in order to build a strong, welcoming culture and a positive learning environment that nurtures all students. Students of color are suspended at higher rates than their White peers. Research has shown that these high suspension rates can ultimately track these students into a school-to-prison pipeline. We believe it is important to celebrate high-performing schools that do not overly rely on harsh discipline policies in order to achieve their results.
- Schools with selective admissions. Schools that are selective in choosing which students to admit are not eligible for inclusion in this report. Public schools should be expected to serve all children, and that is especially important for the schools we lift up as examples of what is possible in public education.
ALL SCHOOLS IN LOS ANGELES COUNTY CAN ACHIEVE THESE SAME RESULTS.
At Innovate Public Schools, we are committed to supporting families and communities in Los Angeles County as they work hard to grow this list of Top Public Schools.
Let these Top Public Schools serve as a model for what’s possible for low-income students of color.
Want to learn more?
If you want to learn how to get involved in advocating to grow the number high-quality schools in Los Angeles, contact our Regional Vice President, Jeimee Estrada at jestrada@innovateschools.org.
For questions about the report, contact our research and policy manager, Jennifer Moore, jmoore@innovateschools.org.
Thank you to the Broad Foundation
for its generous contribution to this report

Dynamic title for modals
Are you sure?
Please confirm deletion. There is no undo!